Impossible List - 15 June
How far I've come over the course of the last month in regards to the impossible list of goals I've set for myself.
So I read a neat little article about the Cost of Thriving index derived in the US to demonstrate the ability of a middle class family to thrive within the economy through time.
So I read a neat little article about the Cost of Thriving index derived in the US to demonstrate the ability of a middle class family to thrive within the economy through time. I was wondering if you could do something similar for the UK and it turns out, meh there or there abouts.
According to American Compass the creators of the Cost of Thriving Index:
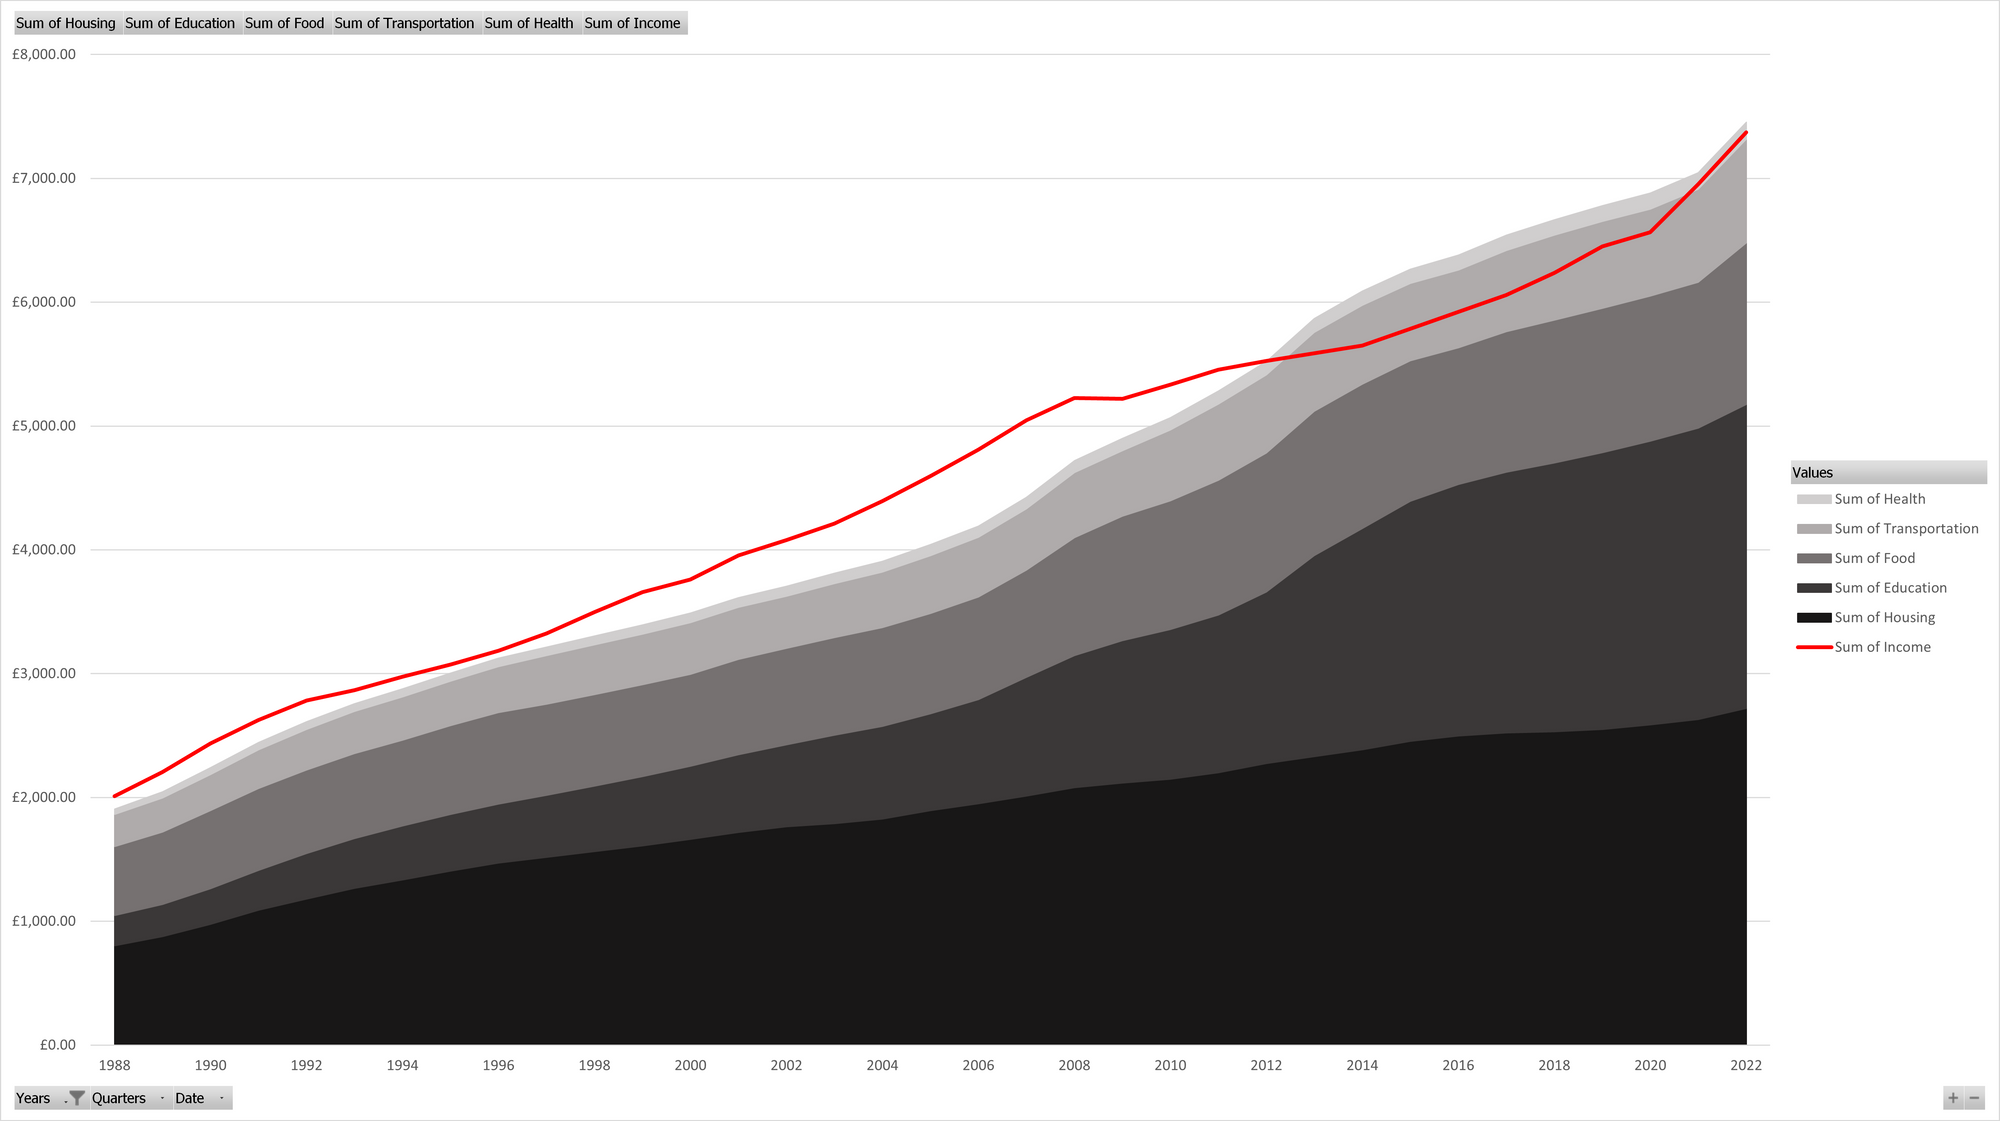
The Cost-of-Thriving Index (COTI) offers a better way to understand the challenge for working families. It avoids reliance on inflation adjustments by instead focusing on the ratio of nominal costs to nominal wages in each year. The Index measures the number of weeks a typical worker would need to work in a given year to earn enough income to cover the major costs for a family of four in the American middle class in that year: Food, Housing, Health Care, Transportation, and Higher Education.
In 1988, UK costs totaled £8,267, while average weekly income for a man working full-time was £168 (£8,736 per year).
In 2022, UK costs totaled £32,301, while average weekly income for a man working full-time was £614 (£31,928 per year).
My little experiment attempts to follow the lead of American Compass.
Food: UK COTI uses the Office for National Statistics Data for Food and Drink Purchases. I then took the Scarborough 2016 Eatwell report data that arrived at a daily cost of the Eatwell Guide at £5.99 per adult per day. For a week that is £41.93 per adult.
Using McClement's equivalency scale we calculated the daily rate of £13.07 per household per day and calculated £91.49 per household per week in 2016. We then reverse engineered the Consumer Price Index (CPI) figures to work out a rough guide of the cost of goods through time. (All of this because we don't appear to keep a lot of publicly accessible data on the actual cost of goods through time).
This is then calculated for a family of 4 and to compensate for people in a household under 19 we used the McClement’s equivalence scale and got 13.07 per household per day. In 1988, this cost was £2,392. In 2022, this cost was £5,668.
Housing: I used the NimbleFins research to get to get the average household's monthly rent for December 2020: £941 then using the same CPI hack to work costs out backwards I saw that in 1988, this cost was £3,484. In 2022, this cost was £11,804.
Health Care: Unlike America for the period of these figures the UK has been well looked after by the NHS which is free of charge except in limited circumstances. However this doesn't extend over into dental so using Dental Health I calculated £196 per year for each individual which when calculated out for the household was £540.96 again using McClement’s equivalence scale. In 1988 this cost was £196 and in 2022 this rose to £590.
Transportation: I again relied on NimbleFins to get the overall cost of running a vehicle in the UK. The figure for 2023 was £3,556 annually. Worked backwards that was £1,127 in 1988 and £3,634 in 2022.
Education: This was a tough nut to crack. It appears that Universities are reluctant to actually help students plan for the very real costs of living while studying. And this might actually suggest my bias, but I was dismayed, but not surprised that Cambridge actually discourages students from taking employment while attending.
There is a range of costs across the UK for different statuses of student from Scottish students at Scottish Universities having £0 in tutition, to £9500 per year in tutition for most English Universities. Looking at a middle range university (University of Essex) we see that they estimate roughly £12,500 per year alongside an estimate of £9,250 for tuition over the course of four years. for a single child education total of £87,000 and two children £174,000. Spread out the saving up of that cost over 8 per child for a total of sixteen years requires saving up £10,875 per year. In 1985 this equated to £1,061 a year where in 2022 it was £10,630.
The Office for National Statistics had very decent data for income over the years. From an average yearly income of £8,736 in 1985 rising to £31,928 in 2022.
Is this flawed, absolutely, does it demonstrate very effectively how impossible it is to achieve the things that we used to assume came with a life spent thriving and giving your children a better existence than you had very much so. You can track the difference in governments fairly well against this, but it doesn't say much for the two main parties in the UK, yes when Labour was in power income started to grow more than expenses, but both parties kept us skimming right over the top of being able to thrive. That's not really the world I want to live in. If I had to make a political statement I'd suggest that we only allow politicians from graduating high school students. And they can only be in power until they are 30 at a high end. I'm sureeven this idea would be corrupted, but I like the idea of people making the decisions not being bought out before they even arrive in office.